
Page 348 - Power Electronics Handbook
P. 348
338 D.C. link frequency changers
is usually the case since large reservoir capacitors are connected
across the d.c. source, so that any voltage fluctuation is very small.
(VI The load current is assumed to be continuous, which is again usually
the case since most inverter loads are inductive, and the operating
frequency is high enough to give continuous current.
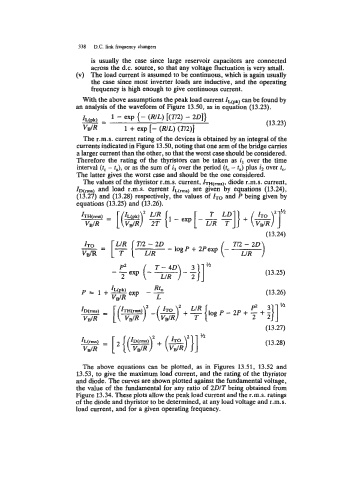
With the above assumptions the peak load current IL(pk) can be found by
an analysis of the waveform of Figure 13.50, as in equation (13.23).
1 - exp {- (RIL) [(T/2) - 201)
-= IL(W (13.23)
VBIR 1 + exp [- (RIL) (Tl2)]
The r.m.s. current rating of the devices is obtained by an integral of the
currents indicated in Figure 13.50, noting that one arm of the bridge cames
a larger current than the other, so that the worst case should be considered.
Therefore the rating of the thyristors can be taken as il over the time
interval (t, - t,), or as the sum of i, over the period (t, - fa) plus i2 over to.
The latter gives the worst case and should be the one considered.
The values of the thyristor r.m.s. current, diode r.m.s. current,
and load r.m.s. current IL(rms) are given by equations (13.24),
(13.27) and (13.28) respectively, the values of fT0 and P being given by
equations (13.25) and (13.26).
(13.24)
LIR TI2 - 20
v$R LIR - log P + 2Pexp
(13.25)
(13.26)
(13.27)
(13.28)
The above equations can be plotted, as in Figures 13.51, 13.52 and
13.53, to give the maximum load current, and the rating of the thyristor
and diode. The curves are shown plotted against the fundamental voltage,
the value of the fundamental for any ratio of 2DIT being obtained from
Figure 13.34. These plots allow the peak load current and the r.m.s. ratings
of the diode and thyristor to be determined, at any load voltage and r.m.s.
load current, and for a given operating frequency.