
Page 112 - Rashid, Power Electronics Handbook
P. 112
98 I. Batarseh
(a)
(b)
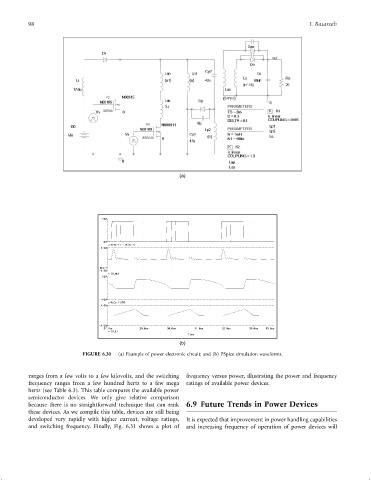
FIGURE 6.30 (a) Example of power electronic circuit; and (b) PSpice simulation waveforms.
ranges from a few volts to a few kilovolts, and the switching frequency versus power, illustrating the power and frequency
frequency ranges from a few hundred hertz to a few mega ratings of available power devices.
hertz (see Table 6.3). This table compares the available power
semiconductor devices. We only give relative comparison
because there is no straightforward technique that can rank 6.9 Future Trends in Power Devices
these devices. As we compile this table, devices are still being
developed very rapidly with higher current, voltage ratings, It is expected that improvement in power handling capabilities
and switching frequency. Finally, Fig. 6.31 shows a plot of and increasing frequency of operation of power devices will