
Page 212 - Rashid, Power Electronics Handbook
P. 212
12 Three-Phase Controlled Recti®ers 201
In order to measure the level of distortion (or undesired 12.3.4.2 Voltage-Source Voltage-Controlled PWM
harmonic generation) introduced by these three control Rectifier
methods, Eq. (12.62) is de®ned: Figure 12.48 shows a one-phase diagram from which the
control system for a voltage-source voltage-controlled recti®er
s
100 1 ð 2 is derived. This diagram represents an equivalent circuit of the
% Distortion ¼ ði line ÿ i Þ dt ð12:62Þ fundamentals, that is, pure sinusoidal at the mains side, and
ref
I rms T T
pure dc at the dc link side. The control is achieved by creating
a sinusoidal voltage template V MOD , which is modi®ed in
In Eq. (12.62), the term Irms is the effective value of the amplitude and angle to interact with the mains voltage V.In
desired current. The term inside the square root gives the rms this way the input currents are controlled without measuring
value of the error current, which is undesired. This formula them. The template V MOD is generated using the differential
measures the percentage of error (or distortion) of the equations that govern the recti®er.
generated waveform. This de®nition considers the ripple, The following differential equation can be derived from
amplitude, and phase errors of the measured waveform, as Fig. 12.48:
opposed to the THD, which does not take into account offsets,
scalings, and phase shifts. di s
Figure 12.46 shows the current waveforms generated by the nðtÞ¼ L S þ Ri þ n MOD ðtÞ ð12:63Þ
s
dt
three forementioned methods. The example uses an average
switching frequency of 1.5 kHz. The PS is the worst, but its p
Assuming that nðtÞ¼ V 2 sin ot, then the solution for i ðtÞ,
s
implementation is digitally simpler. The HB method and TC
to acquire a template V MOD able to make the recti®er work at
with PI control are quite similar, and the TC with only
constant power factor should be of the form:
proportional control gives a current with a small phase shift.
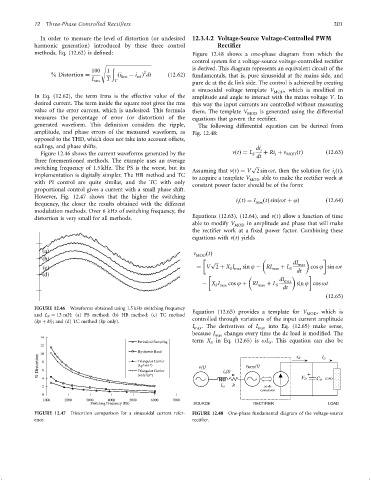
However, Fig. 12.47 shows that the higher the switching
i ðtÞ¼ I max ðtÞ sinðot þ jÞ ð12:64Þ
s
frequency, the closer the results obtained with the different
modulation methods. Over 6 kHz of switching frequency, the
Equations (12.63), (12.64), and nðtÞ allow a function of time
distortion is very small for all methods.
able to modify V in amplitude and phase that will make
MOD
the recti®er work at a ®xed power factor. Combining these
equations with nðtÞ yields
(a) n ðtÞ
(b) MOD p
(c) ¼ V 2 þ X I sin j ÿ RI max þ L S dI max cos j sin ot
S max
(d) dt
dI max
ÿ X I cos j þ RI max þ L S sin j cos ot
S max
dt
ð12:65Þ
FIGURE 12.46 Waveforms obtained using 1.5 kHz switching frequency
Equation (12.65) provides a template for V , which is
and L S ¼ 13 mH: (a) PS method; (b) HB method; (c) TC method MOD
controlled through variations of the input current amplitude
(kp þ ki); and (d) TC method (kp only).
I . The derivatives of I into Eq. (12.65) make sense,
max max
because I changes every time the dc load is modi®ed. The
14 max
Periodical Sampling term X in Eq. (12.65) is oL . This equation can also be
S
S
12
10 Hysteresis Band
% Distortion 8 6 Triangular Carrier v(t) i s(t) v MOD(t)
(kp*+ki*)
Triangular Carrier
(only kp*)
2 4
0
1000 2000 3000 4000 5000 6000 7000
Switching Frequency (Hz)
FIGURE 12.47 Distortion comparison for a sinusoidal current refer- FIGURE 12.48 One-phase fundamental diagram of the voltage-source
ence. recti®er.