Page 254 - Renewable Energy Devices and System with Simulations in MATLAB and ANSYS
P. 254

Electric Generators and their Control for Large Wind Turbines               241


            Note: The multiobjective optimal design of PMSG or DCE-SG could be attempted by multiob-
            jective evolutionary, differential evolutionary, and optimization methodology where FEM machine
            modeling is exclusively used but only in 10–12 points per electrical period to reduce the computa-
            tional time. The computational time is higher (at least 50 h on a strong multi-desk computer crew),
            but much more information on the design and its robustness may be collected [18, 19].
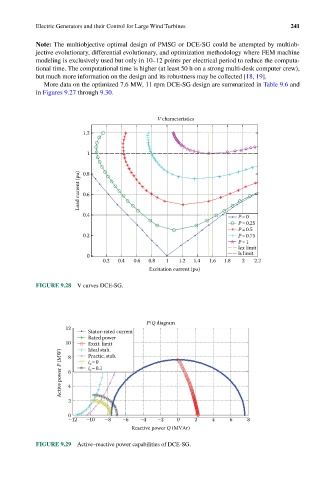
              More data on the optimized 7.6 MW, 11 rpm DCE-SG design are summarized in Table 9.6 and
            in Figures 9.27 through 9.30.


                                                V characteristics
                          1.2


                           1


                         Load current (pu)  0.8


                          0.6


                          0.4                                            P =0
                                                                         P =0.25
                                                                         P =0.5
                          0.2                                            P =0.75
                                                                         P =1
                                                                         lex limit
                           0                                             ls limit
                                0.2  0.4  0.6  0.8  1  1.2  1.4  1.6  1.8  2  2.2
                                              Excitation current (pu)

            FIGURE 9.28  V curves DCE-SG.


                                             P/Q diagram
                     12
                           Stator-rated current
                           Rated power
                     10 8  Excit. limit
                           Ideal stab.
                   Active power P (MW)  6 4  i =0
                           Practic. stab.
                            e
                           i =0.1
                            e


                      2

                      0
                      –12  –10   –8   –6   –4   –2    0    2     4    6    8
                                         Reactive power Q (MVAr)

            FIGURE 9.29  Active–reactive power capabilities of DCE-SG.
   249   250   251   252   253   254   255   256   257   258   259