Page 256 - Renewable Energy Devices and System with Simulations in MATLAB and ANSYS
P. 256

Electric Generators and their Control for Large Wind Turbines               243


                                                                            2.16: >2.4
                                                                            1.92: 2.16
                                                                            1.68: 1.92
                                                                            1.44: 1.68
                                                                            1.20: 1.44
                                                                            0.96: 1.20
                                                                            0.72: 0.96
                                                                            0.48: 0.72
                                                                            0.24: 0.48
                                                                            0.00: 0.24
                                                                          Density plot:
                                                                           |B|, tesla


                     (a)


                                                                            2.16: >2.4
                                                                            1.92: 2.16
                                                                            1.68: 1.92
                                                                            1.44: 1.68
                                                                            1.20: 1.44
                                                                            0.96: 1.20
                                                                            0.72: 0.96
                                                                            0.48: 0.72
                                                                            0.24: 0.48
                                                                            0.00: 0.24
                                                                          Density plot:
                                                                           |B|, tesla


                    (b)

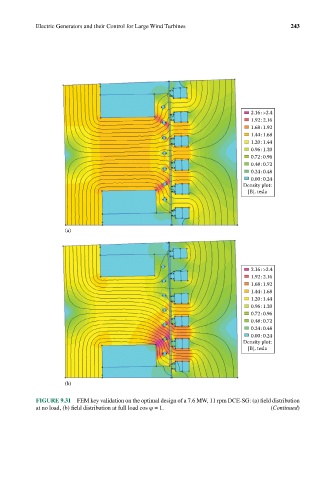
            FIGURE 9.31  FEM key validation on the optimal design of a 7.6 MW, 11 rpm DCE-SG: (a) field distribution
            at no load, (b) field distribution at full load cos φ = 1.            (Continued)
   251   252   253   254   255   256   257   258   259   260   261