Page 193 - Science at the nanoscale
P. 193

10:16
                                                     RPS: PSP0007 - Science-at-Nanoscale
                   June 5, 2009

              ! 
  . 5/  7 -   	
è &    '    N         	    	  
    
   3	

       <3
         è   &J '
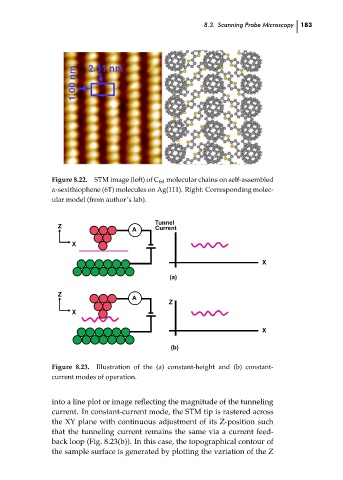
                                        STM image (left) of C 60 molecular chains on self-assembled
                             Figure 8.22.
                             α-sexithiophene (6T) molecules on Ag(111). Right: Corresponding molec-
                             ular model (from author’s lab).
                                                        Tunnel
                              Z
                                                        Current
                                                  A
                                  X
                                                                                    X
                                                            (a)
                              Z
                                                  A
                                                           Z
                                  X
                                                                                    X
                                                            (b)     8.3. Scanning Probe Microscopy  183  ch08
                             Figure 8.23.  Illustration of the (a) constant-height and (b) constant-
                             current modes of operation.
                             into a line plot or image reflecting the magnitude of the tunneling
                             current. In constant-current mode, the STM tip is rastered across
                             the XY plane with continuous adjustment of its Z-position such
                             that the tunneling current remains the same via a current feed-
                             back loop (Fig. 8.23(b)). In this case, the topographical contour of
                             the sample surface is generated by plotting the variation of the Z
   188   189   190   191   192   193   194   195   196   197   198