
Page 161 - Semiconductor Manufacturing Handbook
P. 161
Geng(SMH)_CH12.qxd 04/04/2005 19:49 Page 12.10
PLASMA ETCHING
12.10 WAFER PROCESSING
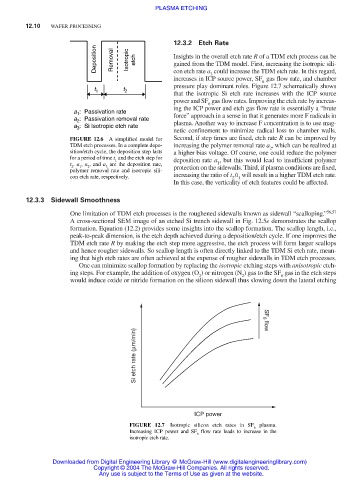
12.3.2 Etch Rate
Deposition Removal Isotropic etch Insights in the overall etch rate R of a TDM etch process can be
gained from the TDM model. First, increasing the isotropic sili-
con etch rate a could increase the TDM etch rate. In this regard,
3
increases in ICP source power, SF gas flow rate, and chamber
6
pressure play dominant roles. Figure 12.7 schematically shows
t 1 t 2
that the isotropic Si etch rate increases with the ICP source
power and SF gas flow rates. Improving the etch rate by increas-
6
ing the ICP power and etch gas flow rate is essentially a “brute
a : Passivation rate
1
a : Passivation removal rate force” approach in a sense in that it generates more F radicals in
2
a : Si Isotropic etch rate plasma. Another way to increase F concentration is to use mag-
3
netic confinement to minimize radical loss to chamber walls.
FIGURE 12.6 A simplified model for Second, if step times are fixed, etch rate R can be improved by
TDM etch processes. In a complete depo- increasing the polymer removal rate a , which can be realized at
2
sition/etch cycle, the deposition step lasts a higher bias voltage. Of course, one could reduce the polymer
for a period of time t and the etch step for deposition rate a , but this would lead to insufficient polymer
1
t . a , a , and a are the deposition rate, 1
2 1 2 3 protection on the sidewalls. Third, if plasma conditions are fixed,
polymer removal rate and isotropic sili-
con etch rate, respectively. increasing the ratio of t /t will result in a higher TDM etch rate.
2 1
In this case, the verticality of etch features could be affected.
12.3.3 Sidewall Smoothness
One limitation of TDM etch processes is the roughened sidewalls known as sidewall “scalloping.” 56,57
A cross-sectional SEM image of an etched Si trench sidewall in Fig. 12.5e demonstrates the scallop
formation. Equation (12.2) provides some insights into the scallop formation. The scallop length, i.e.,
peak-to-peak dimension, is the etch depth achieved during a deposition/etch cycle. If one improves the
TDM etch rate R by making the etch step more aggressive, the etch process will form larger scallops
and hence rougher sidewalls. So scallop length is often directly linked to the TDM Si etch rate, mean-
ing that high etch rates are often achieved at the expense of rougher sidewalls in TDM etch processes.
One can minimize scallop formation by replacing the isotropic etching steps with anisotropic etch-
ing steps. For example, the addition of oxygen (O ) or nitrogen (N ) gas to the SF gas in the etch steps
2
6
2
would induce oxide or nitride formation on the silicon sidewall thus slowing down the lateral etching
Si etch rate (µm/min) SF 6 flow
ICP power
FIGURE 12.7 Isotropic silicon etch rates in SF plasma.
6
Increasing ICP power and SF flow rate leads to increase in the
6
isotropic etch rate.
Downloaded from Digital Engineering Library @ McGraw-Hill (www.digitalengineeringlibrary.com)
Copyright © 2004 The McGraw-Hill Companies. All rights reserved.
Any use is subject to the Terms of Use as given at the website.