
Page 163 - Semiconductor Manufacturing Handbook
P. 163
Geng(SMH)_CH12.qxd 04/04/2005 19:49 Page 12.12
PLASMA ETCHING
12.12 WAFER PROCESSING
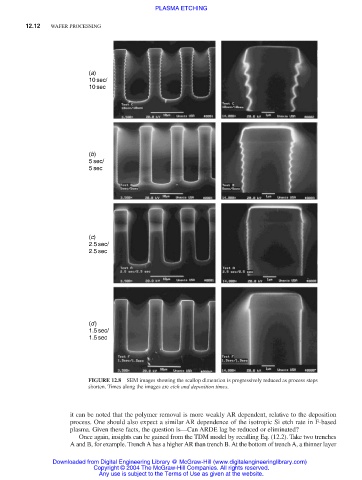
(a)
10 sec/
10 sec
(b)
5 sec/
5 sec
(c)
2.5 sec/
2.5 sec
(d)
1.5 sec/
1.5 sec
FIGURE 12.8 SEM images showing the scallop dimension is progressively reduced as process steps
shorten. Times along the images are etch and deposition times.
it can be noted that the polymer removal is more weakly AR dependent, relative to the deposition
process. One should also expect a similar AR dependence of the isotropic Si etch rate in F-based
plasma. Given these facts, the question is—Can ARDE lag be reduced or eliminated?
Once again, insights can be gained from the TDM model by recalling Eq. (12.2). Take two trenches
A and B, for example. Trench A has a higher AR than trench B. At the bottom of trench A, a thinner layer
Downloaded from Digital Engineering Library @ McGraw-Hill (www.digitalengineeringlibrary.com)
Copyright © 2004 The McGraw-Hill Companies. All rights reserved.
Any use is subject to the Terms of Use as given at the website.