
Page 157 - Separation process principles 2
P. 157
122 Chapter 4 Single Equilibrium Stages and Flash Calculations
and at XH = I, the normal boiling point of normal hexane
(155.7"F). In order for two phases to exist, a point represent-
ing the overall composition of the two-phase binary mixture
at a given temperature must be located in the two-phase
region between the two curves. If the point lies above the
saturated-vapor curve, only a superheated vapor is present;
if the point lies below the saturated-liquid curve, only a sub-
cooled liquid exists.
Suppose we have a mixture of 30 mol% H at 150°F. From
Figure 4.3, at point A we have a subcooled liquid with
XH = 0.3(x0 = 0.7). When this mixture is heated at a con-
stant pressure of 1 atm, the liquid state is maintained until a I I I I I I I I I
temperature of 210°F is reached, which corresponds to point B 0 0.1 0.2 0.3 0.4 0.5 0.6 0.7 0.8 0.9 1.0
on the saturated-liquid curve. Point B is the bubble point Mole Fraction n-hexane in liquid, x
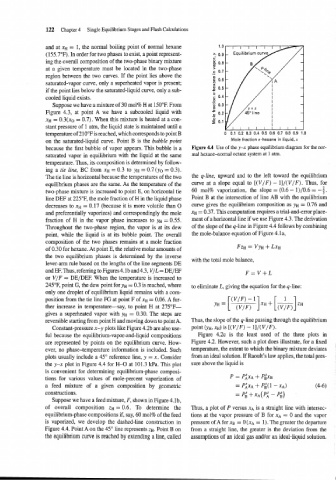
because the first bubble of vapor appears. This bubble is a Figure 4.4 Use of the y-x phase equilibrium diagram for the nor-
saturated vapor in equilibrium with the liquid at the same mal hexane-normal octane system at 1 atm.
temperature. Thus, its composition is determined by follow-
ing a tie line, BC from XH = 0.3 to y~ = 0.7 (yo = 0.3).
The tie line is horizontal because the temperalures of the two the q-line, upward and to the left toward the equilibrium
equilibrium phases are the same. As the temperature of the curve at a slope equal to [(V/ F) - l]/(V/ F). Thus, for
two-phase mixture is increased to point E, on horizontal tie 60 mol% vaporization, the slope = (0.6 - 1)/0.6 = -;.
line DEF at 225"F, the mole fraction of H in the liquid phase Point B at the intersection of line AB with the equilibrium
decreases to XH = 0.17 (because it is more volatile than 0 curve gives the equilibrium composition as y~ = 0.76 and
and preferentially vaporizes) and correspondingly the mole XH = 0.37. This computation requires a trial-and-error place-
fraction of H in the vapor phase increases to y~ = 0.55. ment of a horizontal line if we use Figure 4.3. The derivation
Throughout the two-phase region, the vapor is at its dew of the slope of the q-line in Figure 4.4 follows by combining
point, while the liquid is at its bubble point. The overall the mole-balance equation of Figure 4.la,
composition of the two pl~ases remains at a mole fraction
of 0.30 for hexane. At point E, the relative molar amounts of
the two equilibrium phases is determined by the inverse
with the total mole balance,
lever-arm rule based on the lengths of the line segments DE
and EF. Thus, referring to Figures 4. lb and 4.3, V/L = DE/EF
or V/F = DE/DEF. When the temperature is increased to
245"F, point G, the dew point for y~ = 0.3 is reached, where to eliminate L, giving the equation for the q-line:
only one droplet of equilibrium liquid remains with a com-
position from the tie line FG at point F of x~ = 0.06. A fur-
ther increase in temperature-say, to point H at 275°F-
gives a superheated vapor with y~ = 0.30. The steps are
reversible starting from point H and moving down to point A. Thus, the slope of the q-line passing through the equilibrium
Constant-pressure x-y plots like Figure 4.2b are also use- point CYH, XH) is [( VIF) - I]/( VIF).
ful because the equilibrium-vapor-and-liquid compositions Figure 4.2~ is the least used of the three plots in
are represented by points on the equilibrium curve. How- Figure 4.2. However, such a plot does illustrate, for a fixed
ever, no phase-temperature information is included. Such temperature, the extent to which the binary mixture deviates
plots usually include a 45" reference line, y = x. Consider from an ideal solution. If Raoult's law applies, the total pres-
the y-x plot in Figure 4.4 for H-0 at 101.3 kPa. This plot sure above the liquid is
is convenient for determining equilibrium-phase composi-
tions for various values of mole-percent vaporization of
a feed mixture of a given composition by geometric
constructions.
Suppose we have a feed mixture, F, shown in Figure 4. lb,
of overall composition ZH = 0.6. To determine the Thus, a plot of P versus XA is a straight line with intersec-
equilibrium-phase compositions if, say, 60 mol% of the feed tions at the vapor pressure of B for XA = 0 and the vapor
is vaporized, we develop the dashed-line construction in pressure of A for x~ = 0 (xA = 1). The greater the departure
Figure 4.4. Point A on the 45" line represents ZH. Point B on from a straight line, the greater is the deviation from the
the equilibrium curve is reached by extending a line, called assumptions of an ideal gas andlor an ideal-liquid solution.