
Page 169 - Separation process principles 2
P. 169
134 Chapter 4 Single Equilibrium Stages and Flash Calculation
rium system are temperature, pressure, and the concentra-
tions of the components in each phase. According to the
phase rule, (4-I), for a three-component, two-liquid-phase
system, there are three degrees of freedom. At constant tem-
perature and pressure, specification of the concentration of
one component in either of the phases suffices to completely
define the state of the system. Thus, as shown in Figure 4.14a,
one value for glycol weight percent on the miscibility
boundary curve fixes the composition of the corresponding
phase and, by means of the tie line, the composition of the
other equilibrium phase.
Figure 4.14b is a representation of the same system on a
0 1 2 3 4 5 right-triangular diagram. Here the concentrations in weight
Glycollwater in raffinate percent of any two of the three components (normally the
(d) solute and solvent) are given, the concentration of the third
being obtained by difference from 100 wt%. Diagrams like
this are easier to construct and read than equilateral triangu-
lar diagrams.
However, equilateral triangular diagrams are conve-
niently constructed with the computer program, CSpace,
which can be downloaded from the web site at www.
ugr.es/-cspace.
Figures 4.14~ and 4.14d are representations of the same
ternary system in terms of weight fraction and weight ratios
of the solute, respectively. Figure 4.14~ is simply a plot of
the equilibrium (tie-line) data of Table 4.6 in terms of solute
mass fraction. In Figure 4.14d, mass ratios of solute (ethyl-
ene glycol) to furfural and water for the extract and raffinate
Glycol/(glycol + water)
phases, respectively, are used. Such curves can be used to in-
(e)
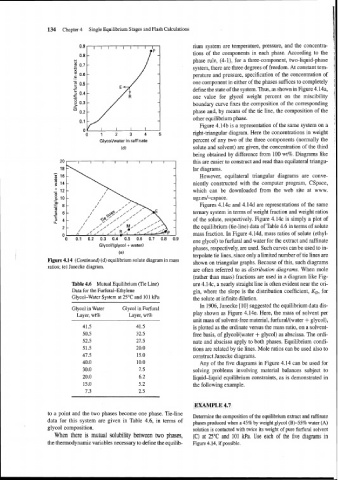
terpolate tie lines, since only a limited number of tie lines are
Figure 4.14 (Continued) (d) equilibrium solute diagram in mass shown on triangular graphs. Because of this, such diagrams
ratios; (e) Janecke diagram.
are often referred to as distribution diagrams. When mole
(rather than mass) fractions are used in a diagram like Fig-
Table 4.6 Mutual Equilibrium (Tie Line) ure 4.14c, a nearly straight line is often evident near the ori-
Data for the Furfural-Ethylene gin, where the slope is the distribution coefficient, KD, for
Glycol-Water System at 25°C and 101 kPa the solute at infinite dilution.
In 1906, Janecke [lo] suggested the equilibrium data dis-
Glycol in Water Glycol in Furfural
Layer, wt% Layer, wt% play shown as Figure 4.14e. Here, the mass of solvent per
unit mass of solvent-free material, furfural/(water + glycol),
is plotted as the ordinate versus the mass ratio, on a solvent-
free basis, of glycol/(water + glycol) as abscissa. The ordi-
nate and abscissa apply to both phases. Equilibrium condi-
tions are related by tie lines. Mole ratios can be used also to
construct Janecke diagrams.
Any of the five diagrams in Figure 4.14 can be used for
solving problems involving material balances subject to
liquid-liquid equilibrium constraints, as is demonstrated in
the following example.
EXAMPLE 4.7
to a point and the two phases become one phase. Tie-line
Determine the composition of the equilibrium extract and raffinate
data for this system are given in Table 4.6, in terms of
phases produced when a 45% by weight glycol (B)-55% water (A)
glycol composition. solution is contacted with twice its weight of pure furfural solvent
When there is mutual solubility between two phases, (C) at 25" and 101 kPa. Use each of the five diagrams in
the thermodynamic variables necessary to define the equilib- Figure 4.14, if possible.