
Page 174 - Separation process principles 2
P. 174
4.7 Solid-Liquid Systems 139
Solid feed, F Overflow, V E
Insoluble A Liquid
Liquid
MIXER-SETTLER
I Underflow, U >
Liquid Solid
--
B, C A
Figure 4.20 Leaching stage.
S x,, Mass of solidlmass of liquid
(a)
overflow is free of solids. The mass ratio of solid to liquid in
the underflow depends on the properties of the two phases
and the type of equipment used, and is best determined from
experience or tests with prototype equipment. In general, if
the viscosity of the liquid phases increases with increasing
solute concentration, the mass ratio of solid to liquid in the
underflow will decrease because the solid will retain more
liquid.
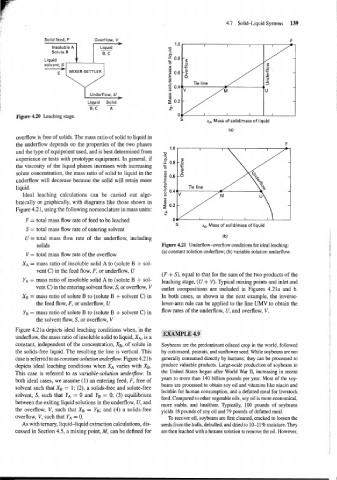
Ideal leaching calculations can be carried out alge-
braically or graphically, with diagrams like those shown in
Figure 4.21, using the following nomenclature in mass units:
F = total mass flow rate of feed to be leached
S x,, Mass of solidlmass of liquid
S = total mass flow rate of entering solvent
U = total mass flow rate of the underflow, including
solids Figure 4.21 Underflow-overflow conditions for ideal leaching:
(a) constant solution underflow; (b) variable solution underflow.
V = total mass flow rate of the overflow
XA = mass ratio of insoluble solid A to (solute B + sol-
vent C) in the feed flow, F, or underflow, U
(F + S), equal to that for the sum of the two products of the
YA = mass ratio of insoluble solid A to (solute B + sol- leaching stage, (U + V). Typical mixing points and inlet and
vent C) in the entering solvent flow, S, or overflow, V outlet compositions are included in Figures 4.21a and b.
XB = mass ratio of solute B to (solute B + solvent C) in In both cases, as shown in the next example, the inverse-
the feed flow, F, or underflow, U lever-arm rule can be applied to the line UMV to obtain the
YB = mass ratio of solute B to (solute B + solvent C) in flow rates of the underflow, U, and overflow, V.
the solvent flow, S, or overflow, V
Figure 4.21a depicts ideal leaching conditions when, in the
underflow, the mass ratio of insoluble solid to liquid, XA, is a
constant, independent of the concentration, XB, of solute in Soybeans are the predominant oilseed crop in the world, followed
the solids-free liquid. The resulting tie line is vertical. This by cottonseed, peanuts, and sunflower seed. While soybeans are not
case is referred to as constant-solution underjlow. Figure 4.2 Ib generally consumed directly by humans; they can be processed to
depicts ideal leaching conditions when XA varies with XB. produce valuable products. Large-scale production of soybeans in
This case is referred to as variable-solution underflow. In the United States began after World War 11, increasing in recent
years to more than 140 billion pounds per year. Most of the soy-
both ideal cases, we assume (1) an entering feed, F, free of
beans are processed to obtain soy oil and vitamins like niacin and
solvent such that XB = 1; (2), a solids-free and solute-free
lecithin for human consumption, and a defatted meal for livestock
solvent, S, such that YA = 0 and YB = 0; (3) equilibrium
feed. Compared to other vegetable oils, soy oil is more economical,
between the exiting liquid solutions in the underflow, U, and
more stable, and healthier. Typically, 100 pounds of soybeans
the overflow, V, such that XB = YB; and (4) a solids-free yields 18 pounds of soy oil and 79 pounds of defatted meal.
overflow, V, such that YA = 0. To recover oil, soybeans are first cleaned, cracked to loosen the
As with ternary, liquid-liquid extraction calculations, dis- seeds from the hulls, dehulled, and dried to 10-11% moisture. They
cussed in Section 4.5, a mixing point, M, can be defined for are then leached with a hexane solution to remove the oil. However,