
Page 171 - Separation process principles 2
P. 171
136 Chapter 4 Single Equilibrium Stages and Flash Calculations
balances apply:
Furfural: 7.1zE + 0.10~~ = 200
Glycol: 0.67zE + 0.37zR = 45
Solving these two simultaneous equations, we obtain zE =
27g, zR = 73g.
Thus, the furfural in the extract = (7.1)(27 g) = 192 g,
the furfural in the raffinate = 200 - 192 = 8 g, the glycol in
the extract = (0.67)(27 g) = 18 g, the glycol in the raffinate =
45 - 18 = 27 g, the water in the raffinate = 73 - 27 = 46 g,
and the water in the extract = 27 - 18 = 9 g. The total extract
is 192 + 27 = 219 g, which is close to the results obtained in
part (a). The raffinate composition and amount can be obtained
just as readily.
--
It should be noted on the Janecke diagram that ME/MR does
not equal RIE; it equals the ratio of RIE on a solvent-free basis.
Mass fraction furfural
In Figure 4.14, two pairs of components are mutually
Figure 4.16 Solution to Example 4.7b.
soluble, while one pair is only partially soluble. Ternary sys-
tems where two pairs and even all three pairs are only partially
Step 2. Substitute these two values into the equation obtained soluble are also common. Figure 4.18 shows examples, taken
by combining (2) with the overall balance, E + R = 300, to
from Francis [ll] and Findlay [12], of four different cases
eliminate R. Solve for E and then R.
Step 3. Check to see if the furfural (or water) balance is where two pairs of components are only partially soluble.
satisfied using the equilibrium data from Figures 4.14a, 4.14b, In Figure 4.18a, two separate two-phase regions are
or 4.14e. If not, repeat steps 1 to 3 with a new guess for wr). formed, while in Figure 4. lac, in addition to the two-phase re-
This procedure leads to the same results obtained in parts gions, a three-phase region, RST, is formed. In Figure 4. 18b,
(a) and (b). the two separate two-phase regions merge. For a ternary mix-
ture, as temperature is reduced, phase behavior may progress
(d) By an equilibrium solute diagram in mass fractions, Fig-
ure 4.14d: This plot suffers from the same limitations as from Figure 4.18a to 4.18b to 4.18~. In Figures 4.18a, 4. lab,
Figure 4.13~ in that a solution must be achieved by an iterative and 4.18c, all tie lines slope in the same direction. In some
procedure. systems of importance, solutropy, areversal of tie-line slopes,
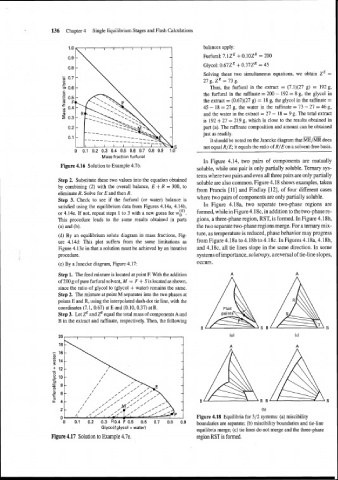
(e) By a Janecke diagram, Figure 4.17: occurs.
Step 1. The feed mixture is located at point F. With the addition
of 200 g of pure furfural solvent, M = F + S is located as shown,
since the ratio of glycol to (glycol + water) remains the same.
Step 2. The mixture at point M separates into the two phases at
points E and R, using the interpolated dash-dot tie line, with the
coordinates (7.1, 0.67) at E and (0.10,0.37) at R.
Step 3. Let zE and ZR equal the total mass of components A and
B in the extract and raffinate, respectively. Then, the following
(b)
Figure 4.18 Equilibria for 312 systems: (a) miscibility
boundaries are separate; (b) miscibility boundaries and tie-line
Glycol/(glycol +water)
equilibria merge; (c) tie lines do not merge and the three-phase
Figure 4.17 Solution to Example 4.7e. region RST is formed.