
Page 37 - Statistics for Environmental Engineers
P. 37
L1592_frame_C03 Page 28 Tuesday, December 18, 2001 1:41 PM
BOD 5 (mg/l) 10
5
0
77 78 79 80 81 82 83 84 85 86 87 88 89 90 91 92
Year
FIGURE 3.4 Time series plot of BOD 5 concentration in the Fox River, Wisconsin.
BOD 5 (mg/l) 10 5
0
J F M A M J J A S O N D
Month
FIGURE 3.5 Seasonal subseries plot of BOD 5 concentration in the Fox River, Wisconsin.
8
90th percentile
7
6 75th
BOD 5 (mg/l) 5 4 50th
3 25th
10th
2
1
75 80 85 90
Starting Year of 5-year Interval
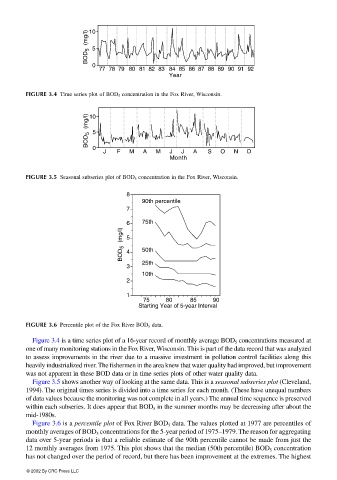
FIGURE 3.6 Percentile plot of the Fox River BOD 5 data.
Figure 3.4 is a time series plot of a 16-year record of monthly average BOD 5 concentrations measured at
one of many monitoring stations in the Fox River, Wisconsin. This is part of the data record that was analyzed
to assess improvements in the river due to a massive investment in pollution control facilities along this
heavily industrialized river. The fishermen in the area knew that water quality had improved, but improvement
was not apparent in these BOD data or in time series plots of other water quality data.
Figure 3.5 shows another way of looking at the same data. This is a seasonal subseries plot (Cleveland,
1994). The original times series is divided into a time series for each month. (These have unequal numbers
of data values because the monitoring was not complete in all years.) The annual time sequence is preserved
within each subseries. It does appear that BOD 5 in the summer months may be decreasing after about the
mid-1980s.
Figure 3.6 is a percentile plot of Fox River BOD 5 data. The values plotted at 1977 are percentiles of
monthly averages of BOD 5 concentrations for the 5-year period of 1975–1979. The reason for aggregating
data over 5-year periods is that a reliable estimate of the 90th percentile cannot be made from just the
12 monthly averages from 1975. This plot shows that the median (50th percentile) BOD 5 concentration
has not changed over the period of record, but there has been improvement at the extremes. The highest
© 2002 By CRC Press LLC