
Page 792 - Industrial Power Engineering and Applications Handbook
P. 792
23/748 Industrial Power Engineering and Applications Handbook
Rating of the secondary distribution transformer = 30 MVA,
3310.4 kV,
zp = 10% (after applying the negative tolerance)
Load currents at different harmonics are recorded as follows:
35.5
33.4 kV v~=-xxooov
d3
I 60 kVA Harmonic order Load current (A)
1 (fundamental) 400
3 a
5 50
7 27.5
9 a
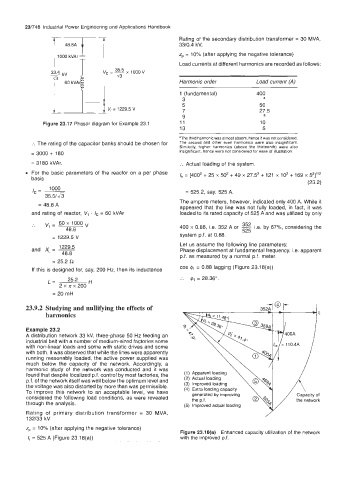
Figure 23.17 Phasor diagram for Example 23.1 11 10
13 5
aThe third harmonic was almost absent. hence It was not considered.
:. The rating of the capacitor banks should be chosen for The second and other even harmonics were also insignificant.
Similarly, higher harmonics (above the thirteenth) were also
= 3000 + 180 insignificant. hence were not considered for ease of illustration
= 31 80 kVAr. :. Actual loading of the system.
For the basic parameters of the reactor on a per phase /h = [400’ + 25 x 50‘ + 49 x 27.5’ + 121 x 1 o2 + 169 x 5’1”’
basis
(23.2)
I,= ~ 1000 = 525.2, say, 525 A.
35.5/&
= 48.8 A The ampere meters, however, indicated only 400 A. While it
appeared that the line was not fully loaded, in fact, it was
and rating of reactor, VI . IC = 60 kVAr loaded to its rated capacity of 525 A and was utilized by only
.
.. vl = 60 x 1000 v 352 .
1.e.
48.8 400 x 0.88, Le. 352 A or - by 67%, considering the
525
= 1229.5 V system p.f. at 0.88.
Let us assume the following line parameters:
1229.5
and X,= - Phase displacement at fundamental frequency, Le. apparent
48.8 p.f. as measured by a normal p.f. meter.
= 25.2 R
If this is designed for, say, 200 Hz, then its inductance cos $, = 0.88 lagging (Figure 23.18(a))
L= 25.2 ... $1 = 28.36”.
2 x ZX 200
= 20 mH
23.9.2 Studying and nullifying the effects of
harmonics
Example 23.2
A distribution network 33 kV, three-phase 50 Hz feeding an
industrial belt with a number of medium-sized factories some
with non-linear loads and some with static drives and some
with both. It was observed that while the lines were apparently
running reasonably loaded, the active power supplied was
much below the capacity of the network. Accordingly, a
harmonic study of the network was conducted and it was
found that despite localized p.f. control by most factories, the (2) Actual loading
p.f. of the network itself was well below the optimum level and (3) Improved loading
the voltage was also distorted by more than was permissible. (4) Extra loading capacity
To improve this network to an acceptable level, we have generated by improving
considered the following load conditions, as were revealed the p.f. the network
through the analysis. (5) Improved actual loading
Rating of primary distribution transformer = 30 MVA,
132133 kV
zp = 10% (after applying the negative tolerance)
Figure 23.18(a) Enhanced capacity utilization of the network
I, = 525 A (Figure 23.18(a)) with the improved p.f.