Page 252 - System on Package_ Miniaturization of the Entire System
P. 252

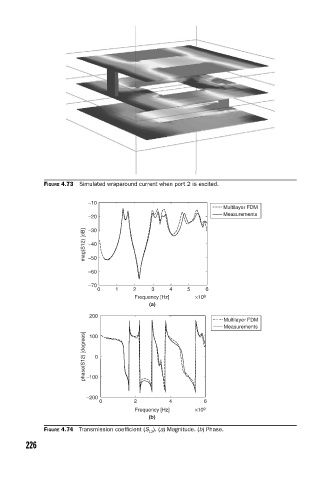
FIGURE 4.73  Simulated wraparound current when port 2 is excited.

                                 –10
                                                                        Multilayer FDM
                                                                        Measurements
                                 –20
                                 –30
                                mag(S12) [dB]  –40


                                 –50

                                 –60
                                 –70
                                    0    1    2    3    4    5     6
                                              Frequency [Hz]    ×10 9
                                                  (a)
                                 200
                                                                        Multilayer FDM
                                                                        Measurements
                                phase(S12) [degrees]  –100 0
                                 100


                                –200
                                    0         2         4         6
                                              Frequency [Hz]    ×10 9
                                                  (b)
                    FIGURE 4.74  Transmission coeffi cient (S 12 ). (a) Magnitude. (b) Phase.

               226
   247   248   249   250   251   252   253   254   255   256   257