
Page 151 -
P. 151
4.3 Theoretical Analysis II – Fluid Dynamics 141
(a) (b)
Pressure Shearing stress
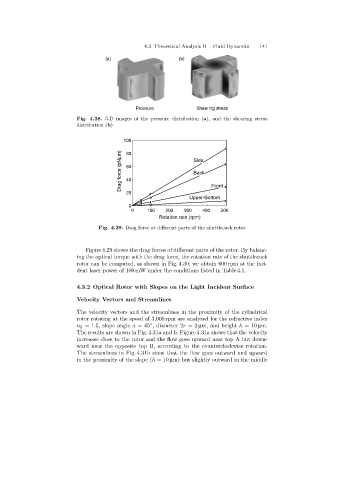
Fig. 4.28. 3-D images of the pressure distribution (a), and the shearing stress
distribution (b)
100
Drag force (pNmm) 60 Side
80
Back
40
20 Front
Upper-Bottom
0
0 100 200 300 400 500
Rotation rate (rpm)
Fig. 4.29. Drag force at different parts of the shuttlecock rotor
Figure 4.29 shows the drag forces of different parts of the rotor. By balanc-
ingthe optical torque with the dragforce, the rotation rate of the shuttlecock
rotor can be computed, as shown in Fig. 4.30; we obtain 600 rpm at the inci-
dent laser power of 100 mW under the conditions listed in Table 4.1.
4.3.2 Optical Rotor with Slopes on the Light Incident Surface
Velocity Vectors and Streamlines
The velocity vectors and the streamlines in the proximity of the cylindrical
rotor rotatingat the speed of 3,000 rpm are analyzed for the refractive index
◦
n 2 =1.5, slope angle a =45 , diameter 2r =3 µm, and height h =10 µm.
The results are shown in Fig. 4.31a and b. Figure 4.31a shows that the velocity
increases close to the rotor and the flow goes upward near top A but down-
ward near the opposite top B, accordingto the counterclockwise rotation.
The streamlines in Fig. 4.31b show that the flow goes outward and upward
in the proximity of the slope (h =10 µm) but slightly outward in the middle